cutting a Rust GPUI launcher's idle memory
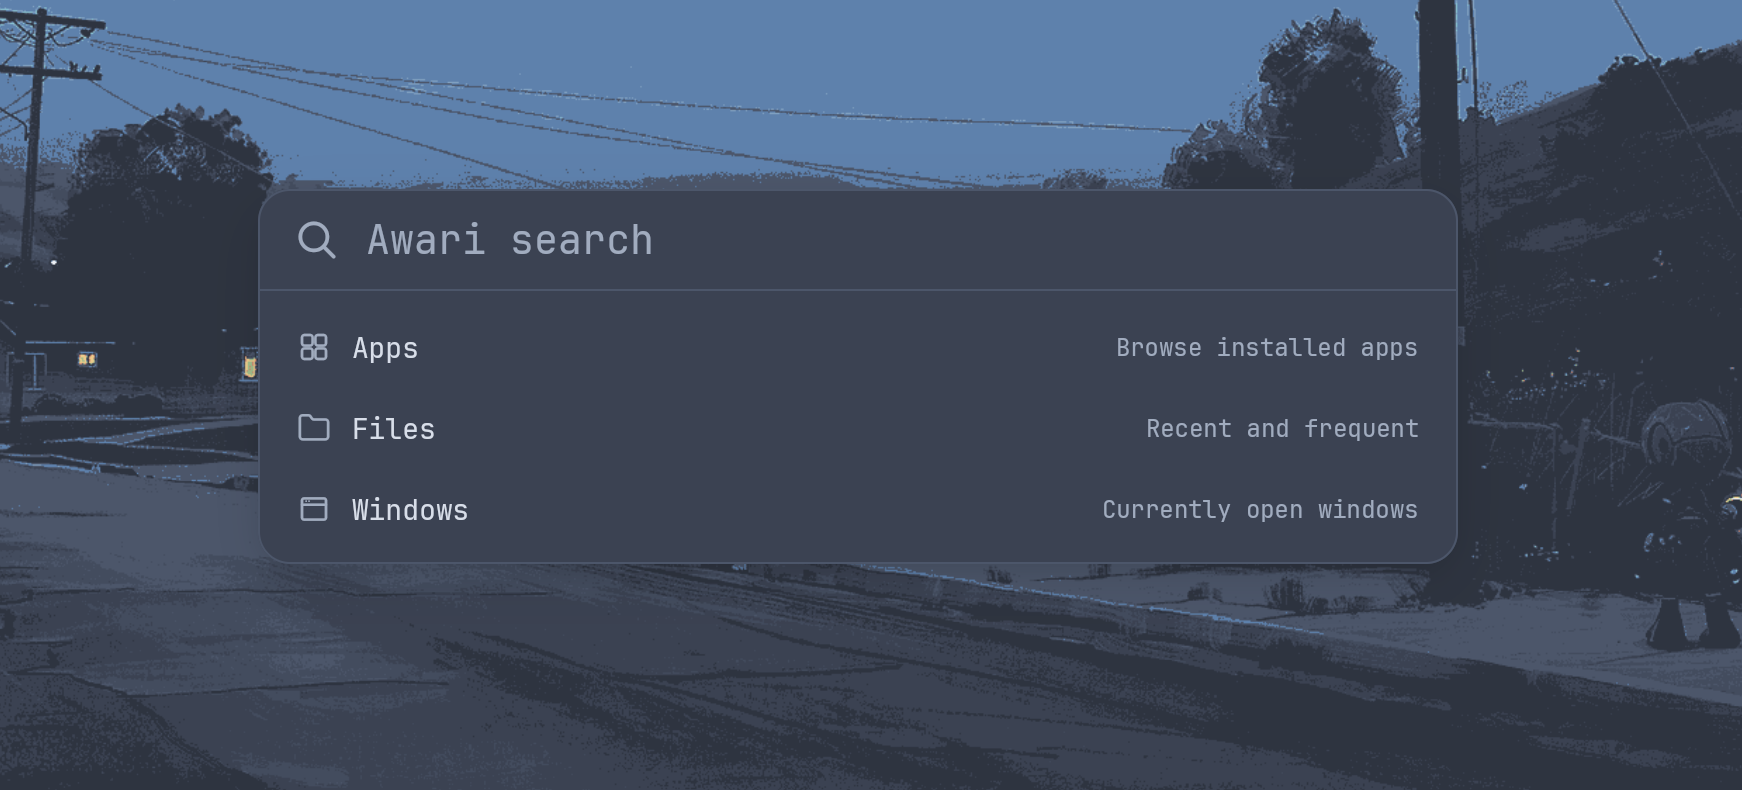
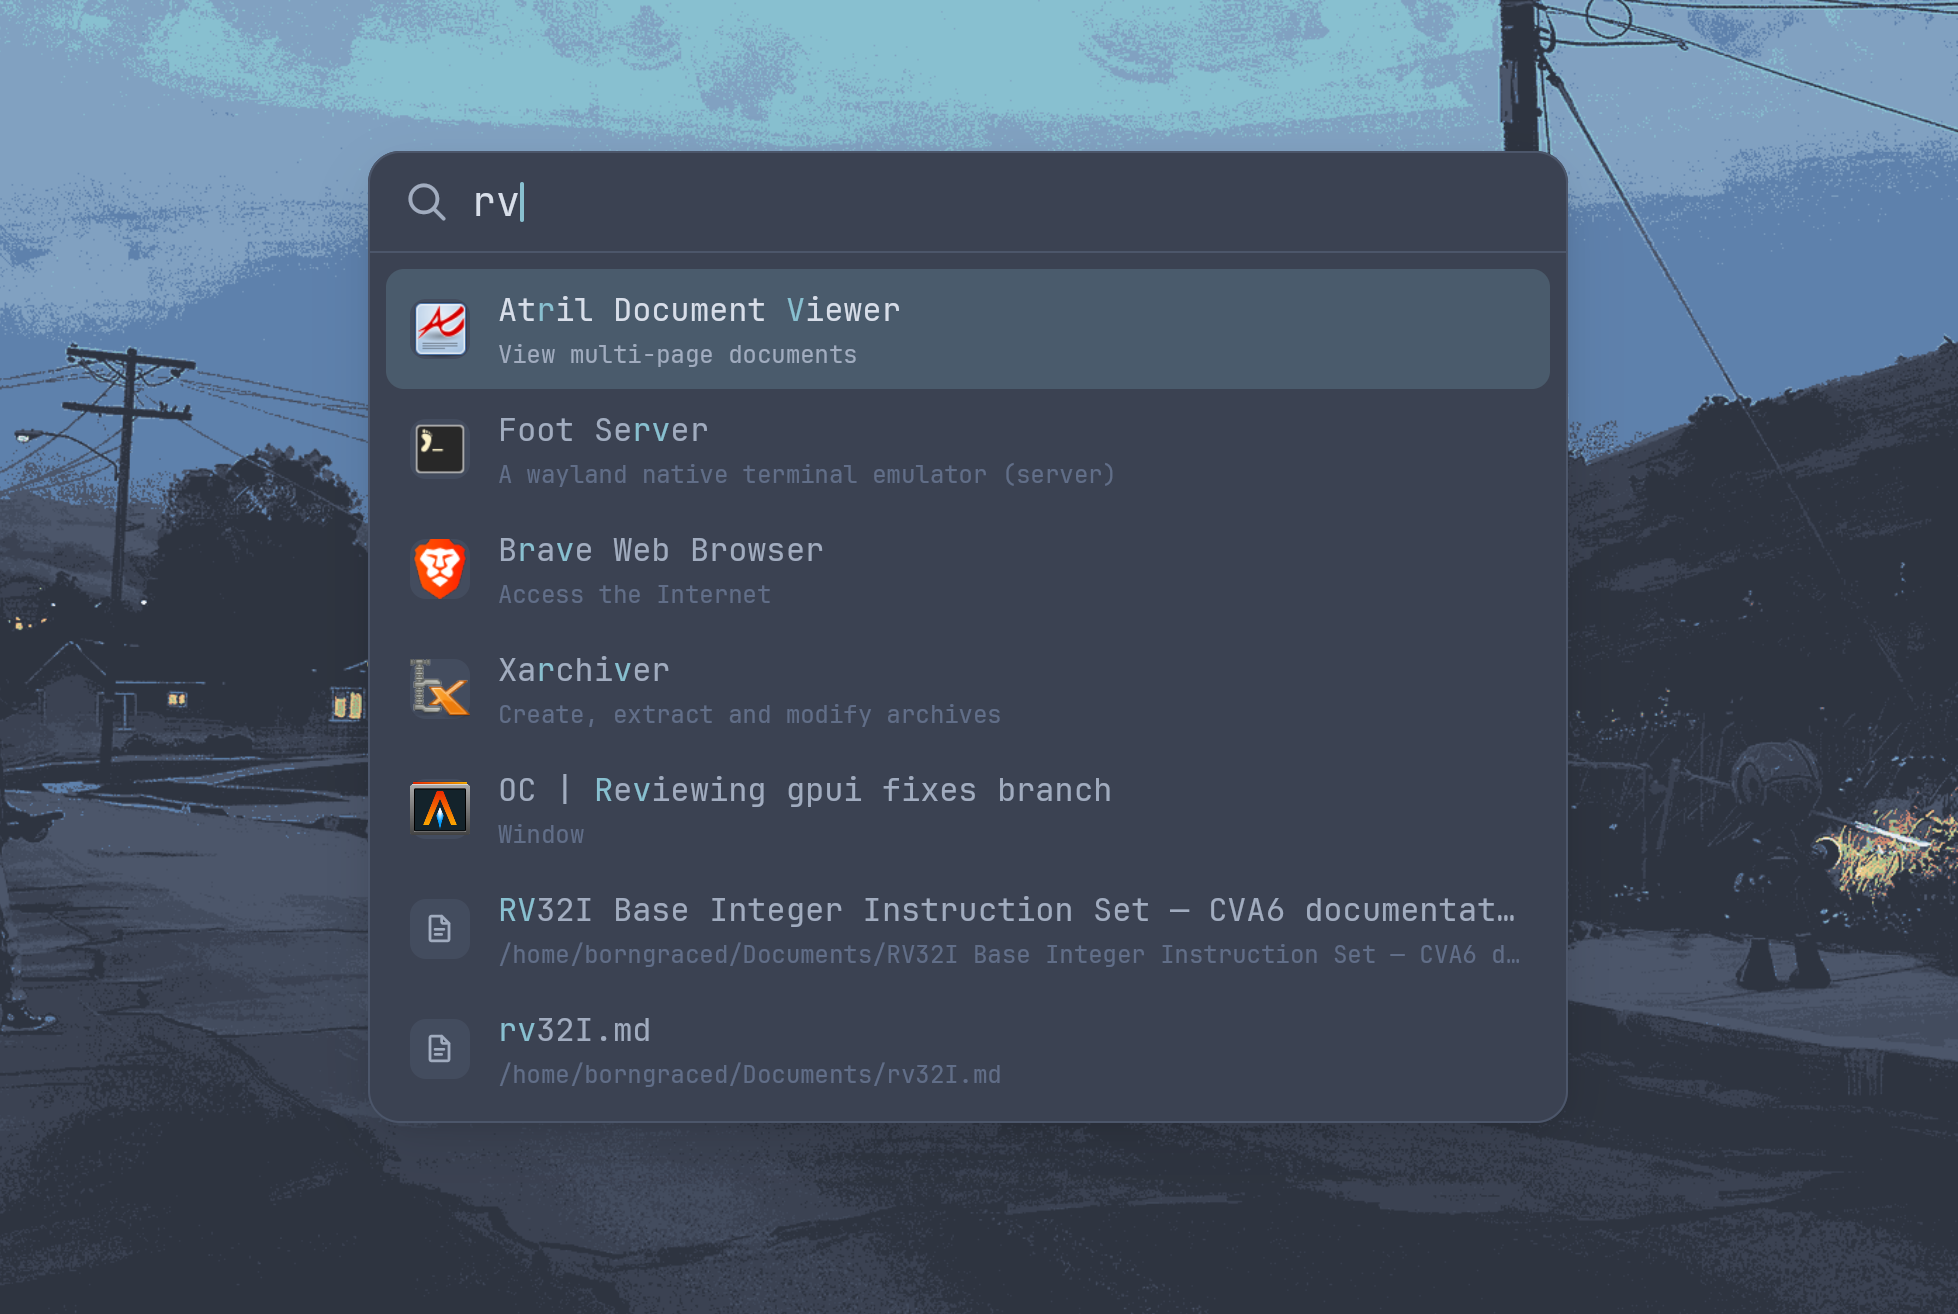
I have been working on awari, a Wayland app launcher built on GPUI, the framework Zed uses for its own interface, so you bind a key to awari toggle-launcher, an overlay opens where you type to fuzzy-filter windows, apps and files from one list, hit enter, and it launches your pick and gets out of the way. When I first measured it, it sat at about 141 MiB at rest and kept growing as I typed. A launcher should be a few megabytes and basically invisible, so I spent a few days profiling and fixed it down to ~39 MiB idle, and it holds at ~70 while you search instead of ratcheting up.
All numbers are the release build on x86_64 / Intel Lunar Lake, RSS from
/proc/<pid>/status. The relative savings hold.
The GPU device outlives your window
gpui keeps the wgpu device, the shaders and the font atlas at the App level, where an Arc<wgpu::Device> lives inside WgpuContext. Hiding the launcher window only drops the surface, and the device, the shader modules and the glyph atlas stay mapped until the process exits, and there is no “free the GPU memory on close” to call.
It took me a few days to accept this, and in the meantime I tried quitting the GUI every time it dismissed so the memory would come back right away, and it did, but the next hotkey then paid a full GPU re-warm, which felt worse than keeping the memory around, so I stopped doing that and looked for a different way. The real fix is to not build the device until you need it, so I moved ensure_launcher to the first open instead of warming the GPU at boot, and a hidden launcher that never opened stopped costing me anything.
hidden, never opened 141 MiB -> ~39 MiB
If you genuinely want the memory back rather than instant re-open, there is drop mode, quit on dismiss, and a reaper respawns a fresh hidden GUI ~100 ms later. But you cannot have both instant re-open and a freed device, that is gpui’s design, not a bug in your code.
The Vulkan loader maps every ICD it finds
WgpuContext::instance() builds a wgpu::Backends::VULKAN | GL instance and lets the loader enumerate every ICD it finds. Software renderers like lavapipe, llvmpipe and dzn are worth tens of MB each, and the GL backend pulls in the whole EGL/gallium stack, all of it getting mapped into your process just so wgpu can pick an adapter.
I actually got this one into Zed proper. The PR is zed-industries/zed#63346, gpui_wgpu: Skip software Vulkan ICDs and GL on Linux startup. Before vkCreateInstance, set this.
VK_LOADER_DRIVERS_DISABLE=*lvp*,*lavapipe*,*llvmpipe*,*dzn*,*swrast*,*swiftshader*
Software and translated ICDs never load, and if the loader is too old to honor that (pre-1.3.234), the instance is created Vulkan-only, so the GL stack is not initialized just to list adapters. It fails open, so if you already set driver vars yourself, it does nothing, and if instance creation fails, it unsets the deny list and falls back to defaults.
GPU warm on open   ~78 MiB  ->  ~36 MiB
in-use, settled    ~141 MiB ->  ~70 MiB
Because it lives in the shared gpui_wgpu crate, Zed’s startup gets the same ~36 to 49 MiB back too, so it is not an awari-only trick.
Sprite atlases only grow up
gpui’s sprite atlas is append-only. Glyphs and icon tiles accumulate with every session, and nothing trims them. In a long-lived keep-alive launcher, that is a slow leak you will not notice until you measure it.
The fix is boring but needed, add a clear() to the atlas trait, a no-op by default, a real override in WgpuAtlas, and call Window::clear_sprite_atlas() on open and on hide. The atlas goes back to baseline between sessions.
Letting the framework decode your icons is a cliff
I originally handed gpui a full-resolution RenderImage for every icon, which gave me a ~47 MiB concurrent-allocation spike while typing and scrolling, exactly the “it grows as you use it” thing people were complaining about.
The fix is to decode icons locally, reading the file with fs::read and decoding it with the image crate, where SVG has to go through gpui’s SvgRenderer/resvg since the image crate cannot decode SVG. Then bound the GPU cache, ICON_GPU_RETENTION = 48 icons with LRU eviction, keep the CPU-side Arc so a recently evicted icon re-uploads cheaply, and cap the result list at MAX_FILE_RESULTS = 30, at which point the working set stops climbing.
Guess where the bytes are and you’ll be wrong
My first guess was the file index, since it walks 70k files, but it turned out the index is only ~26 MiB. The ~80 MiB was GPU, font and atlas pre-warm, and I would still be blaming the index if I had not actually measured at lifecycle points.
I threw in a small [boot] RSS trace at the moments that matter.
pre-gpui              ~37 MiB
post-files            ~44 MiB   (file index built)
daemon-new-done       ~45 MiB
post-ensure-launcher  ~128 MiB  (GPU warmed)
settled-2s            ~141 MiB
The gap between daemon-new-done (45) and post-ensure-launcher (128) is the GPU warm, and once I saw that I knew to measure at lifecycle points rather than just “after launch”.
The allocator can ratchet while you type
The GPU was not the only thing growing. With a cold, unchanged index, per-keystroke search spun up fff-search worker threads, and glibc gives every new thread its own malloc arena. Every scan cycle allocated in a fresh arena and then released the memory. The live heap stayed flat at ~47 MiB, but the freed pages stayed mapped in that per-thread arena. So RSS climbed with every typing session and never came back down. And malloc_trim(0) only trims the main arena, leaving the secondary arenas at their high-water mark.
The fix is two lines (glibc ≥ 2.10).
cmd.env("MALLOC_ARENA_MAX", "2");   // GUI child spawn
mallopt(M_ARENA_MAX, 2);            // main(), return ignored
Cap the arena count and glibc starts reusing arenas. Identical-query cycles that used to climb 85 to 94 to 102 MiB now stay flat at ~70 MiB, and the after-close baseline converges instead of drifting. My benchmark showed no scan latency regression. On musl there are no per-thread arenas and both calls are no-ops, worst case is you get nothing.
Your debugging tools measure different truths
Every tool I used was technically right, and every one of them tricked me on its own.
- heaptrack is brutal and slow. I could not profile an interactive typing session under it, so I scripted one (150 ms/keystroke) and traced the live heap. It gave me the truth about allocations and said nothing about RSS.
- massif (valgrind) only sees malloc and only live allocations. It showed the heap flat at ~47 MiB, which was correct and completely useless. If I trusted it alone, I would have “proven” there was no problem at all.
- smaps shows regions, not owners. The ratchet hid in anonymous
rwmappings, not[heap]. To pin them on glibc per-thread arenas I crossed/proc/<pid>/mapsthread stacks with heaptrack’s thread attribution, 15.73 MiB on one worker thread, that kind of detective work no tool does for you. malloc_trimonly trims the main arena and silently fails on the rest.- RSS is sampling-time-sensitive. Idle vs typing vs after-close with settling time, or the numbers just wallpaper over the problem.
- Microbenchmarks will lie to you. A tiny C arena microbenchmark told me
cap = 2raises RSS, but my real app is mmap-dominant, large Vecs bypass arenas entirely.
My rule became to triangulate, heaptrack for runtime allocations, smaps/maps for resident memory, and neither one alone explains a climbing RSS.
The result
| State | Before | After |
|---|---|---|
| Idle, hidden (never opened) | ~141 MiB | ~39 MiB |
| In use (after first open, settled) | ~141 MiB | ~70 MiB |
| GPU warm on open | ~78 MiB | ~36 MiB |
| Icon decode allocation spike | ~47 MiB | gone |
| Typing RSS ratchet (identical cycles) | climbs 85→94→102 | flat ~70 |
awari daemon (GPU-free, release) |
~7 MiB | ~7 MiB |
About a quarter of the old figure at idle, and half while you are actually using it.
If you are fighting memory on gpui, start with the lazy overlay and the ICD filter, since that is where the bytes actually went, then work the rest down with a ruler in hand.
Repo here: github.com/borngraced/awari